Networking for Dragon Game Framework : Observability
I’ve been working on Dragon Game Framework (DragonGF), an MMO networking library for a while now. With it being an MMO framework, data observability needs to be good. Time to build a Unity editor window!
Collecting Data #
First I need to collect the data. Lidgren, the networking library I use for DragonGF, has basic statistics collection, but does not have it time-sliced for trends and graphs. To go over the basic concepts of how DragonGF works, anything with networked data or that can move is known as an entity and entities have data made of components. Components are updated by the server periodically, and clients can send command requests which are much like RPCs. Events are usually one-shots sent from the server to the clients to denote actions like jumping, shooting, and deaths. Ultimately, data usage can be categorized by Entity Creation, Commands, Updates, and Events.
Now that these are better defined, the current time-slice I use is 1 second. Every 1 second window, I collect received and sent data into message and bytes buckets and create a new bucket every 1 second window. I want to use that historical data eventually but the current window editor only looks at the last second. For memory considerations, I’m only keeping the last few minutes at most.
public void RecordMessage(int id, int bytes, DataStat stat)
{
            var timeSlice = _timeSlices[0];
            switch (stat)
            {
                case DataStat.Command:
                    timeSlice.RecordMessage(id, bytes, timeSlice.Commands);
                    break;
                case DataStat.Event:
                    timeSlice.RecordMessage(id, bytes, timeSlice.Events);
                    break;
                case DataStat.Update:
                    timeSlice.RecordMessage(id, bytes, timeSlice.Updates);
                    break;
                case DataStat.Entity:
                    timeSlice.RecordMessage(id, bytes, timeSlice.Entities);
                    break;
            }
}
This can probably be improved later with more arrays but it will do by now.
Displaying the Data #
Now that the data is organized by type and timeslice, let’s display it!Unfortunately Unity does not have a built-in table view for editor windows but they do have examples on how to use the tree view. The newer UI Elements that use xml might have a table but I am not familiar with how that works yet, so I am using the older IMGUI editor window.
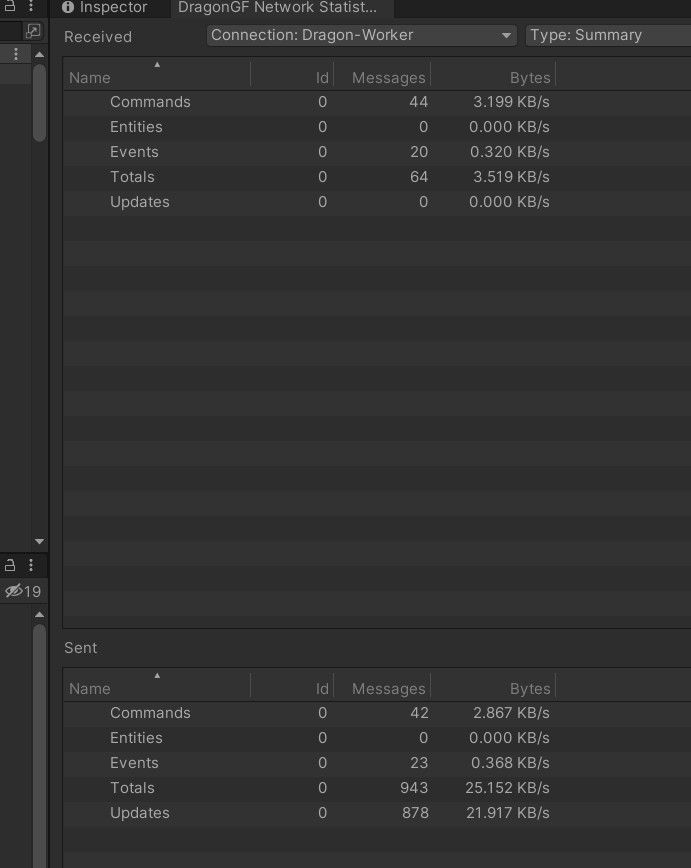
For data visualization, we need to be able to select the server or client, and select Commands, Events, Updates, Entities, or a total Summary of each. Commands, Updates, and Events, will visualize by component type so we will be able to optimize each component as necessary. We can conveniently run the server and client at the same time in the editor so grabbing the relevant connections and adding them to the dropdowns is relatively easy.
Some Time Later #

Tada, we can observe the networking data now! And, uh oh… We are using way too much. We are currently at 21 KB/s (kilobytes per second) for updating positions which we need to lower. I'm not familiar with what the target should be but I would like to get it down to 10 KB/s which is... 80 kilobits per second for about 50-100 moving entities.
I'm not entirely sure what the data target is but I see but I've seen 256 kilobits per second over on Glenn Fiedler's blog. That is... 32 KB/s. The lower we get the position and rotation usage, the more players and things we can have.
Why is Position Data so High? #
Let's look at the data payload for Position. We currently have a Position as 3 doubles (64 bit floats) to represent a very large potential game space which we send updates for at 10 Hz (10 every second). Each message contains a byte for message type, 4 bytes for the entity id, and 2 bytes for the component id. If we add it all together, each message is 8+8+8+1+4+2 = 31 bytes, plus a little more overhead. At 10 Hz, that is 310 bytes per second per moving entity. With just 100 moving entities, that's 31 Kilobytes per second for only position.
How do we lower position usage? #
Next up, I will cover what I did to lower location data usage by switching to fixed point decimals.
- Previous: Inconsistent Site Rebrand
- Next: Top Games 2022